Is JUNE the best Drag-&-Drop-E-Mail-Editor?
27. February 2023
Is gated content still up-to-date?
6. October 2023
E-mail marketing activities of the 1,000 top-selling German online shops:
September 27, 2023
Marketing automation platform market share in 2023 and marketing trends
Every year we analyse the email marketing of Germany’s 1,000 top-selling online shops and we did so again in 2023 on behalf of the EHI Retail Institute‘s and ecommerceDB‘s E-commerce Market Study 2023. The results are similar to what we have already established in recent years and also in our five-year comparison in 2022:
- E-mail remains a must-have for online marketing: 89.2% of all shops surveyed send marketing e-mails, only 6.1% offer no newsletter sign-up at all. a
- Almost all shops use an email service provider (ESP) or a sending service, namely 97.4% of the 892 shops from which we received at least one marketing e-mail in the twelve-month study period. b
- The 20 most frequently used platforms are exactly the same as last year, even if the order is not identical.
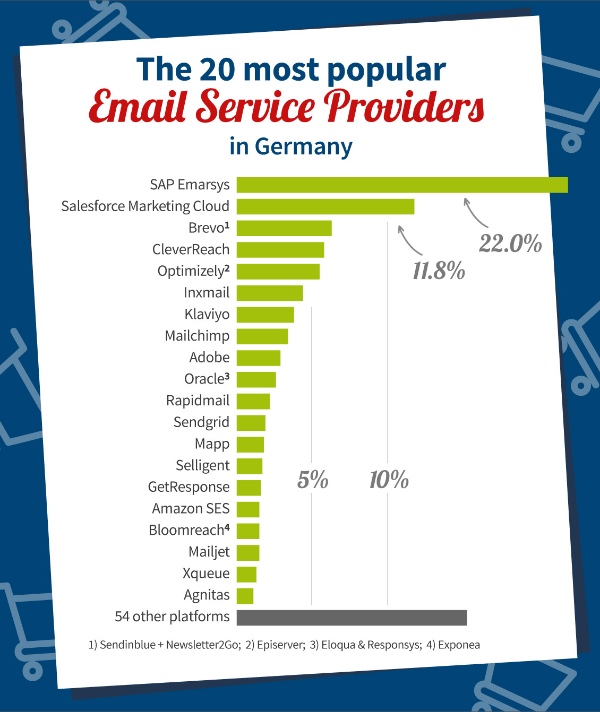
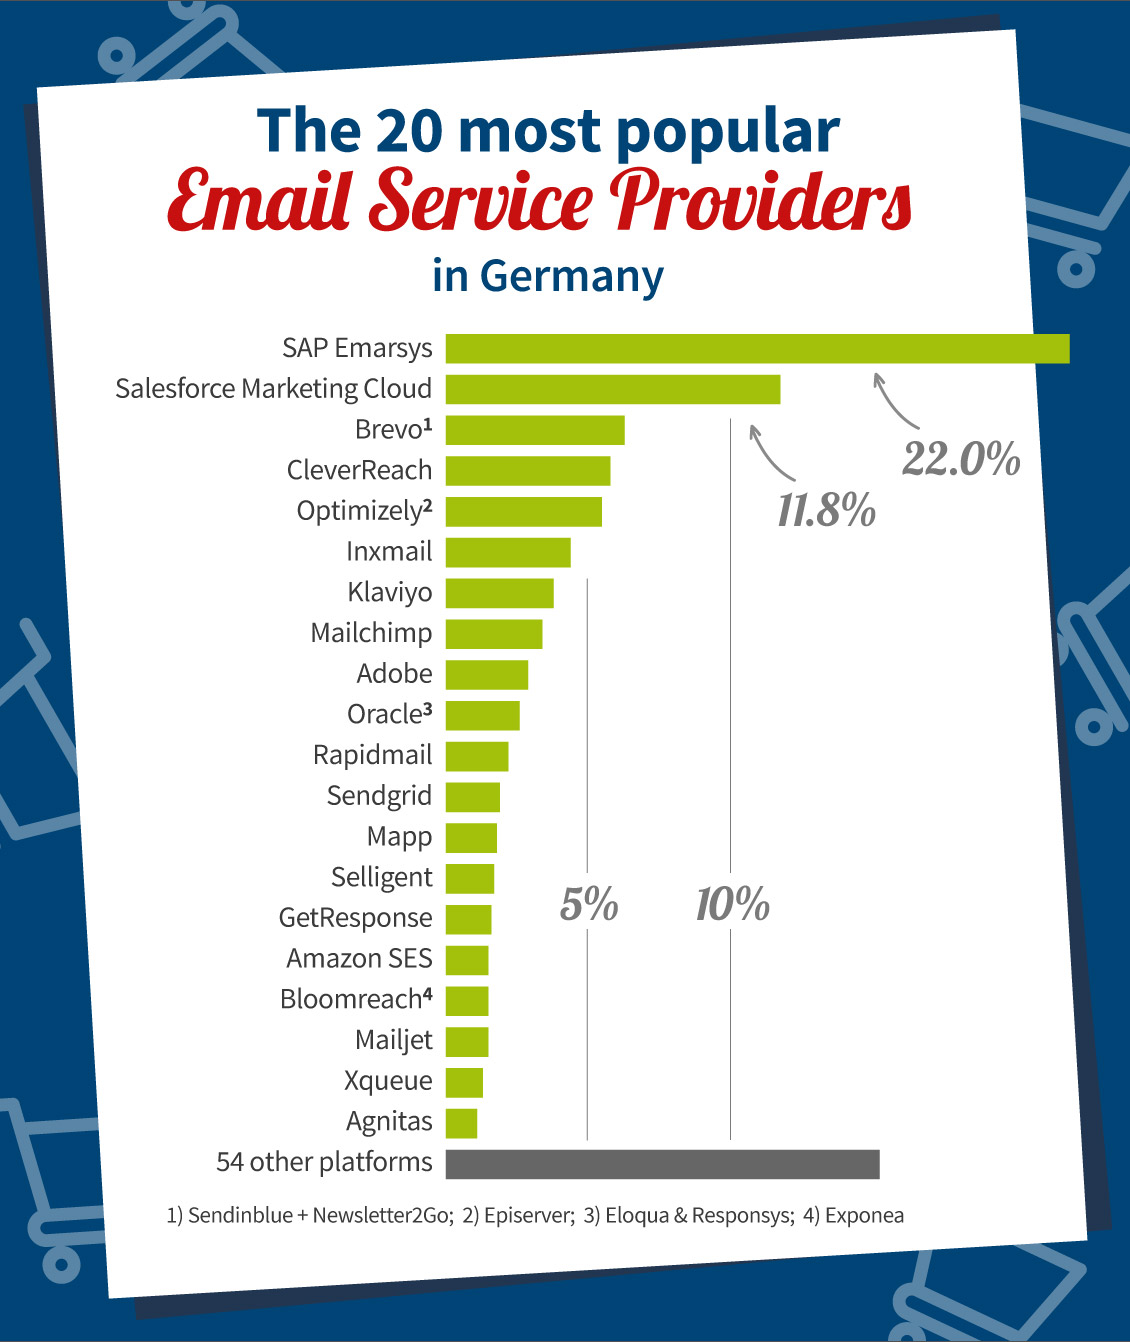
The 20 most popular email service providers in 2023
SAP Emarsys is once again at the top, followed by Salesforce Marketing Cloud. These two companies account for around a third of the market, with a slight upward trend (33.8% vs. 32.3% in 2022). Optimizely, for which we diagnosed a five-year decline in market share last year, continues to lose ground to only 5.5% of the shops in our analysis, slipping behind CleverReach and Brevo (the new name of Sendinblue & Newsletter2Go) among the most used platforms in e-commerce. These two “self-service” platforms have swapped places, CleverReach from 6.4 to 5.8%, Brevo from 5.4 to 6.3%. Here too, a trend of recent years is continuing. Klaviyo, Rapidmail, Bloomreach and GetResponse also made slight gains – in all cases a continuation of the longer-term trend. Only Mailjet bucks the trend: 1.5% after 1.3% last year, but 2.0% in 2021. The rest of the represented platforms maintain their share (such as Mailchimp with 3.4%) or show slight losses, including Oracle Marketing Cloud and the Amazon SES sending service.
Overall, we still see a highly fragmented market with a small top group of powerful multichannel tools that seem to have more or less exhausted their market segment, and a disparate midfield with a “long tail” of vendors with market shares below 1%. What is not new, but remarkable, is that after the top 20 there are 54 (!) more platforms with a combined market share of 15.3% – more than the second-placed Salesforce Marketing Cloud.
Where is the innovation?
But why? Shouldn’t markets with many similar products consolidate as they mature? And especially in the online business, vendors benefit from economies of scale and network effects, where revenues grow rapidly as the number of customers grows, but personnel and development costs do not. While we may be seeing exactly that with Optimizely’s slow but steady decline, if we just look at the “enterprise” solutions segment: These ESPs together make up a stable 40% or so of the market, and Salesforce has been gaining here for years. Self-service platforms such as Brevo and CleverReach (with “Made in Germany” and “Made in Europe” respectively) are also gaining ground in the “mid-market” segment. However, this is not a consolidation, the forces of inertia seem to be stronger – platform changes cost money and involve risks, the motto of marketers seems to be “never change a running system”.
But this also means that the need for new features does not seem too great; the suffering from outdated or simply crude user interfaces in some of the ‘legacy’ solutions seems bearable. In any case, no platform seems to have managed to wow marketing teams with a standout ‘must-have’ feature or service – even though the tools are known to be constantly evolving and promising new possibilities. Whether it’s AI, customer data platform, shop system integration, web push or interactive elements, there doesn’t seem to be a vendor that is bringing such fundamental and unique innovations to the platform that they are causing a massive shift in the market. The market seems mature and saturated; one could even say, heretically, sluggish.
The bottom line: Eventually, the Tesla of email marketing may come along and shake up the market, but not yet. For now, financial and staffing considerations are at the forefront of platform usage. In times of rising costs and falling margins, online shops need to keep their email marketing spend down. This is reflected in the emails: They have to sell products – there is little room for elaborate extras, as our new content analysis shows.
What’s inside? Prices, products, layout and elements
This year, for the first time, we looked at at least the last four emails we received from each of the “Top 1,000” online shops that sent us marketing emails during the survey period, and rated them qualitatively. Admittedly, this is only a snapshot. But it gives a good idea of the current state of email marketing in e-commerce.
The recipe for marketing success seems to be: lots, fast and simple. Emails are produced at high frequency and with few “bells and whistles”, i.e. without long prefaces, without pictures, without “cool” functions – and with little variation in presentation. At most, they might include an eye-catching animated GIF.
Sales instead of story
- Little copy, lots of products: 88% of shops focus clearly on products and product sales in all newsletters, rather than on storytelling and context. Only 10% of shops use longer texts for background topics and product descriptions in all their newsletters.
- This is in line with the fact that predominantly products are shown directly and without people (77%).
- The aim is to drive sales – and this works best with appropriate incentives: 41% refer to discounts and special offers in the shop in all newsletters and a further 38% in some of the newsletters viewed. This also applies to the e-commerce subject lines we looked at in last year’s study.
- Almost half of the shops (49%) do not mention specific prices in their newsletters. Of the 51% of shops that do mention prices in their newsletters, 41% emphasise the promotional nature of the offer by mentioning a starting price.

Variety of topics instead of focus
- 64% of online shops include several themes in all their newsletters and show products from different product categories.
- Only 26% of shops have one main theme per newsletter and do not feature other products or categories in that edition.
- How are customers addressed? 45% address customers on a first name basis, 39% on a first call basis. The remainder avoid direct customer contact altogether.
- 20% include ‘trust elements’ such as seals and awards in their emails to emphasise the trustworthiness of the online shop. Examples include Trusted Shops, EHI, TÜV, Trustpilot, Chip, ComputerBild or NTV, which are used as a guarantee of the shop’s quality. There are also very creative people who simply create their own seals.

Templates instead of pixel art
- Most shops use a common base for their emails, such as templates, so that newsletters from one brand look the same. This ensures high recognition value and fast, efficient production. 53% of newsletters look very much alike from issue to issue and 30% look quite similar. Only 1% of businesses send out highly personalised emails every time.
- CI-compliant design, branding and logos ensure a visual link to the brand and the shop.
- 73% of online shops have a navigation in their emails that is the same as on their website, referring to important and popular shop categories.
- The vast majority of newsletters have a white or light background colour (67% of emails are predominantly white, 11% light monochrome). A design with only black or a dark basic colour, i.e. “dark mode first”, is realised by very few shops (2%).

Tried and tested instead of innovation
- Every year, email marketing experts proclaim the trends of the year in. According to many, one trend is to integrate more interactive elements in emails, for example through AMP. gamification, sliders, interactive galleries, surveys or simple “did you like this newsletter?” polls. However, according to our analysis, 94% of shops do not actually do this on a regular basis. Only 6% want the recipient to interact with their brand beyond a “buy now” call to action.
- It is also fitting that only 13% of shops ask their recipients to manage their newsletter settings and topic preferences via an interest management/preference centre. Read more on this topic here.
- Another trend in the industry is the integration of customer testimonials, user-generated content and reviews. However, only 4% of shops include customer ratings and reviews in the emails we saw.
- Social media content is rarely used 1:1 in newsletters. Only 6.6% include YouTube videos or Instagram posts in their newsletters. However, 85% refer to their social media presence through icons.
Finally, a figure that may indicate a small trend: 20% of senders no longer include a link to the online version in their marketing emails (when clicked, this link opens the email as an HTML page in the web browser). The importance of the online version link is declining. Technically, there are no longer many reasons why it is needed. But it seems many marketers do not want to get rid of it completely: many emails now “hide” the link to the online version in the footer – even if this means that it loses its original purpose as a quick way out of “unreadable” emails.
The Market Shares of Email Service Providers Used by the Top 1,000 Online Shops in Germanyb
| Email Service Provider | market share 2023 | 2022 in % | 2021 in % | 2020 in % | 2019 in % | 2018 in % |
| SAP Emarsys | 22.0% | 21.5 | 22 | 22.8 | 23.3 | 21.9 |
| Salesforce Marketing Cloud | 11.8% | 10.6 | 11.1 | 10.5 | 8.2 | 5.3 |
| Brevo (Sendinblue + Newsletter2Go) | 6.3% | 5.4 | 4 | 4.1 | 3.2 | 3.6 |
| CleverReach | 5.8% | 6.4 | 5.8 | 7 | 7.6 | 7 |
| Optimizely (Episerver/Optivo) | 5.5% | 6.7 | 7.7 | 9.8 | 11 | 12.2 |
| Inxmail | 4.4% | 5.1 | 6.3 | 7.1 | 7.5 | 6.8 |
| Klaviyo | 3.8% | 3.1 | 1.9 | 0.8 | 0.5 | 0.3 |
| Mailchimp | 3.4% | 3.4 | 4.8 | 6.1 | 6.4 | 6.6 |
| Adobe | 2.9% | 3 | 3.5 | 3.4 | 3 | 3 |
| Oracle (Responsys) | 2.6% | 2.8 | 2.9 | 2.5 | 2.5 | 2.9 |
| Rapidmail | 2.2% | 2 | 2 | 1.6 | 1.8 | 1.2 |
| Sendgrid * | 1.9% | 2.1 | 1.7 | n/a** | n/a** | n/a** |
| Mapp | 1.8% | 2.1 | 2.8 | 2.8 | 3.7 | 5.1 |
| Amazon SES * | 1.5% | 1.9 | 2.2 | n/a** | n/a** | n/a** |
| Mailjet | 1.5% | 1.3 | 2 | 1.3 | 0.8 | 0.4 |
| Selligent | 1.7% | 1.8 | 1.4 | 1.3 | 1.7 | 1.6 |
| GetResponse | 1.6% | 1.3 | 1.3 | 0.5 | n/a | 0.1 |
| Bloomreach (Exponea) | 1.5% | 1.2 | 0.8 | 0.6 | n/a | n/a |
| Xqueue | 1.3% | 1.3 | 1.8 | 1.9 | 1.7 | 1.6 |
| Agnitas | 1.1% | 1.2 | 1.2 | 1.1 | 1.3 | 1.6 |
| Other Email Service Providers | Market Share 2023 |
| Cheetah Digital | 0.9% |
| SAP Marketing Cloud | 0.9% |
| Active Campaign | 0.7% |
| Artegic | 0.7% |
| Iterable | 0.7% |
| Braze | 0.6% |
| Deploytech (Clang) | 0.6% |
| Hubspot | 0.6% |
| Mailgun | 0.6% |
| Microsoft Dynamics 365 | 0.6% |
| Mailingwork | 0.5% |
| Retarus | 0.5% |
| SALESmanago | 0.5% |
| Voyado | 0.5% |
| dotmailer | 0.3% |
| mission‹one› | 0.3% |
| SparkPost | 0.3% |
| Shopware | 0.3% |
| Acoustic Campaign | 0.2% |
| ContactLab | 0.2% |
| Copernica | 0.2% |
| Customer.io | 0.2% |
| EmailLabs | 0.2% |
| Marketo | 0.2% |
| Ometria | 0.2% |
| RedEye | 0.2% |
| Sailthru | 0.2% |
| Spotler | 0.2% |
| Swift Mailer | 0.2% |
| Arvato (eLettershop) | 0.1% |
| Atrivio | 0.1% |
| Campaign.Plus | 0.1% |
| Compost Carma | 0.1% |
| Consultix ProCampaign | 0.1% |
| drumedar | 0.1% |
| Elastic Email | 0.1% |
| Fotone.Net | 0.1% |
| Interspire | 0.1% |
| JUNE | 0.1% |
| Klick-Tipp | 0.1% |
| Listrak | 0.1% |
| Mailkit | 0.1% |
| MailMan | 0.1% |
| MailUp | 0.1% |
| Mailworx | 0.1% |
| Microsoft 365 (Outlook + Exchange) | 0.1% |
| Netcore Cloud | 0.1% |
| OpenText | 0.1% |
| SC Networks (Evalanche) | 0.1% |
| sendeffect | 0.1% |
| Ubivox | 0.1% |
| Vero | 0.1% |
| Wayfair in-house platform | 0.1% |
| Websale | 0.1% |
Method and Population
Our analysis is based on the 1,000 highest-revenue B2C online shops and selected marketplaces as identified by the EHI Retail Institute and ecommerceDB: “Study of Germany’s e-commerce market 2023”, ranked by their e-commerce revenue in fiscal year 2022.
a Online shops that sent out at least one marketing email within the 12-month observation period. (in % – n = 892)
b Online shops that sent out emails via a distribution platform identified as an ESP or sending service within the 12-month observation period. The market share percentages have been calculated based on the number of retailers that could be identified as users of the respective senders. (n = 873)
* Excluding companies that use this sending service as a back end sender of a marketing automation platform, for these companies the “front end” email service provider is listed (where the ESP was identifiable).
** Sending services were ranked for the first time in 2021.


